Nüance-R provides this course to teach you how to open and plot a shapefile. Take a look at this course!
Definition
Shapefiles are a common way to store geospatial data.
“A Shapefile is a simple, nontopological format for storing the geometric location and attribute information of geographic features. Geographic features in a shapefile can be represented by points, lines, or polygons (areas).” - Environmental Systems Research Institute (2016)
Links
Usually, you need to dig the internet to find the shapefile you are interested in. However, multiples links to download shapefiles will be shared with you below.
Good for a map of :
- the entire world: Natural Earth
- a specific country: Datapages
- a specific country and it’s region and subregions: GADM
- the United States: United States Census Bureau
- Europe: Eurostat
- Canada: StatCan
Download
To use a shapefile, download the .zip file and then upload it on your platform.
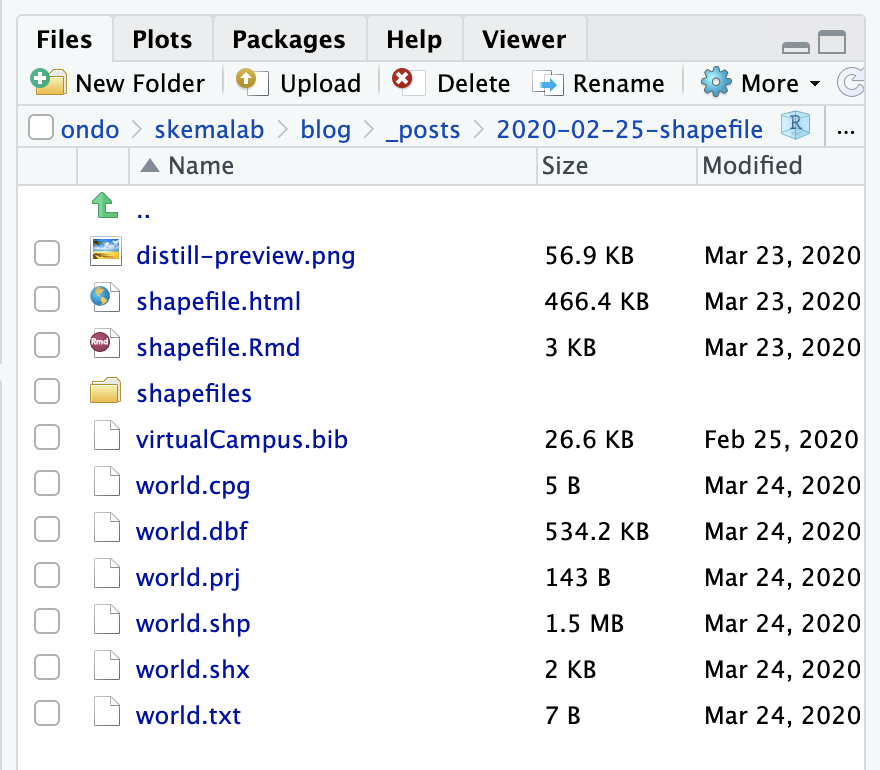
Remember, the .zip file must contain at least the .shp, .shx, .dbf, and .prj files components of the shapefile for your Shapefile to work properly.