In order to provide an efficient way to get data from Statistics Canada, we have created an R package named statcanR. This course will teach you how to use statcanR.
Loading Data
library(statcanR)
mydata <- statcan_data("27-10-0014-01","eng")
Detailed arguments of the function:
27-10-0014-01: Statistic Canada table number
eng: Language of the table
With a simple web search ‘statistics canada wages by industry metropolitan area monthly’, the table number can easily be found on Statisitcs Canada’s webpage. Here is below a figure that illustrates this example, such as ‘27-10-0014-01’ for the Federal expenditures on science and technology, by socio-economic objectives.
Manipulating Data
The date (column REF_DATE) needs to be transformed, so we can apply a real date format.
We need to create a subset of our data to create a graph.
mydata <- mydata[mydata$`Science and technology components`=="Research and development", ]
mydata <- mydata[mydata$`Socio-economic objectives`!="Total socio-economic objectives"]
mydata <- mydata[mydata$`Type of expenditures`=="Intramural"]

names(mydata)[names(mydata) == "Socio-economic objectives"] <- "se_objectives"

library(dplyr)
mydata <- filter(mydata, se_objectives == "Energy"|
                 se_objectives == "Environment"| se_objectives == "Health" | se_objectives == "Telecommunication")
Visualizing Data
palette <- c("#f8c72d", "#db0a16", "#255293", "black")
library(ggplot2)
library(ggthemes)
ggplot(data = mydata, aes(x = date, y = VALUE)) +
geom_line(aes(colour=se_objectives), size = 0.8) +
theme_hc() +
theme(legend.position="right", title=element_text(size=10)) +
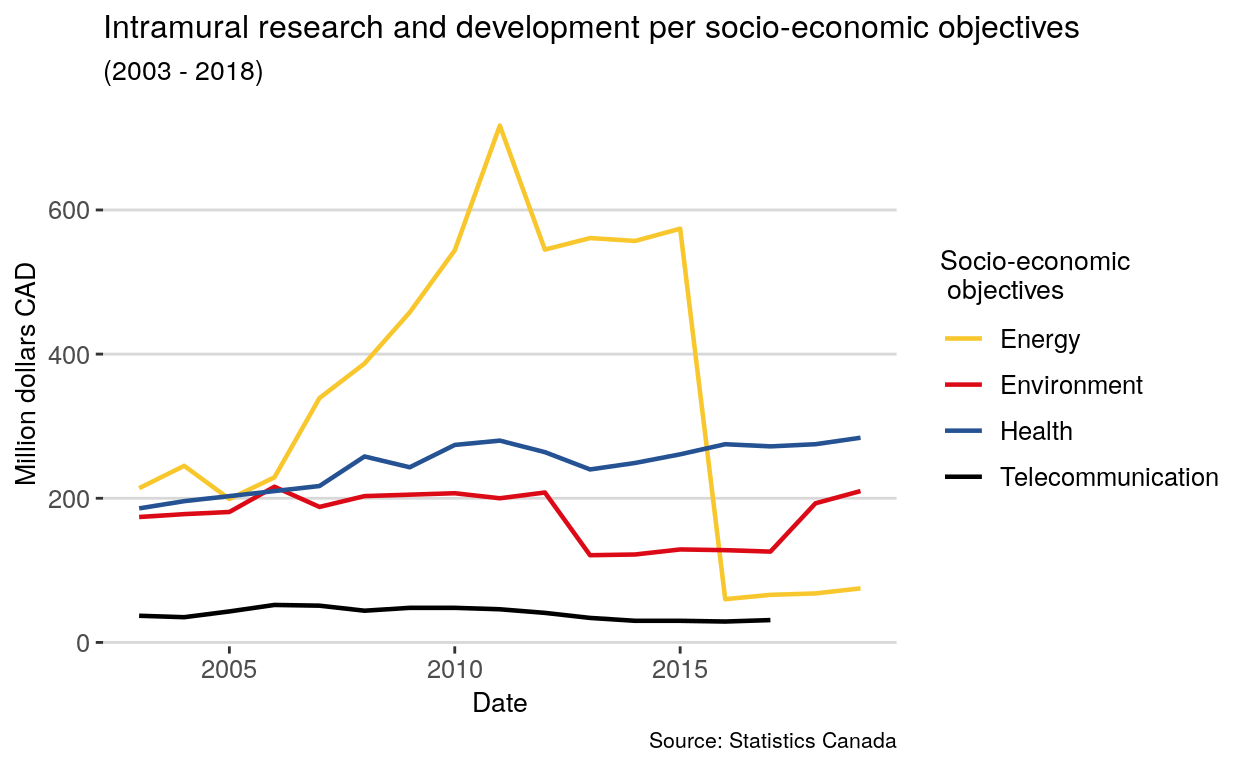
labs(title = "Intramural research and development per socio-economic objectives",
subtitle = "(2003 - 2018)",
x = "Date",
y = "Million dollars CAD",
colour = "Socio-economic\n objectives",
caption = "Source: Statistics Canada") +
scale_color_manual(values = palette)