This course will teach you how to use the Quandl package. Quandl allow you to collect financial and economic datasets from hundreds of publishers.
Registering API key
# Load the fredR library
library(Quandl)
# Enter your API key in the function "Quandl.api_key"
Quandl.api_key("abcdefghijklmnopqrstuvwxyz123456")
Before using the Quandl package, you have to (freely) register to the institution.
After confirming your email adress to validate the key, you will have to enter your API key in the function Quandl.api_key(). This will take the API Key given by Quandl and will allow the access to the database.
Extracting data
Quandl() function
Quandl.datatable() function
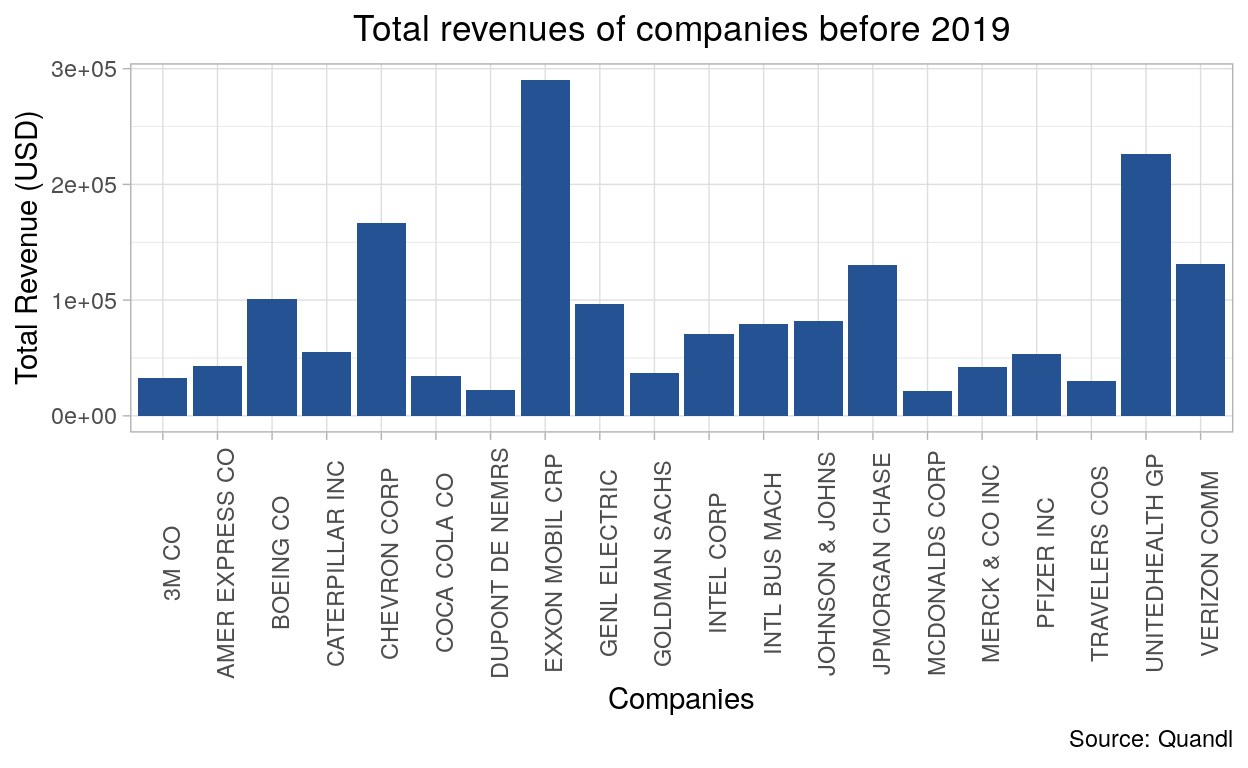
# The total revenues of companies before 2019
mydatafun = Quandl.datatable("ZACKS/FC", per_type="A", per_end_date="2018-12-31", qopts.columns=c("m_ticker", "comp_name","currency_code", "tot_revnu", "per_type", "per_end_date"))
Visualizing data
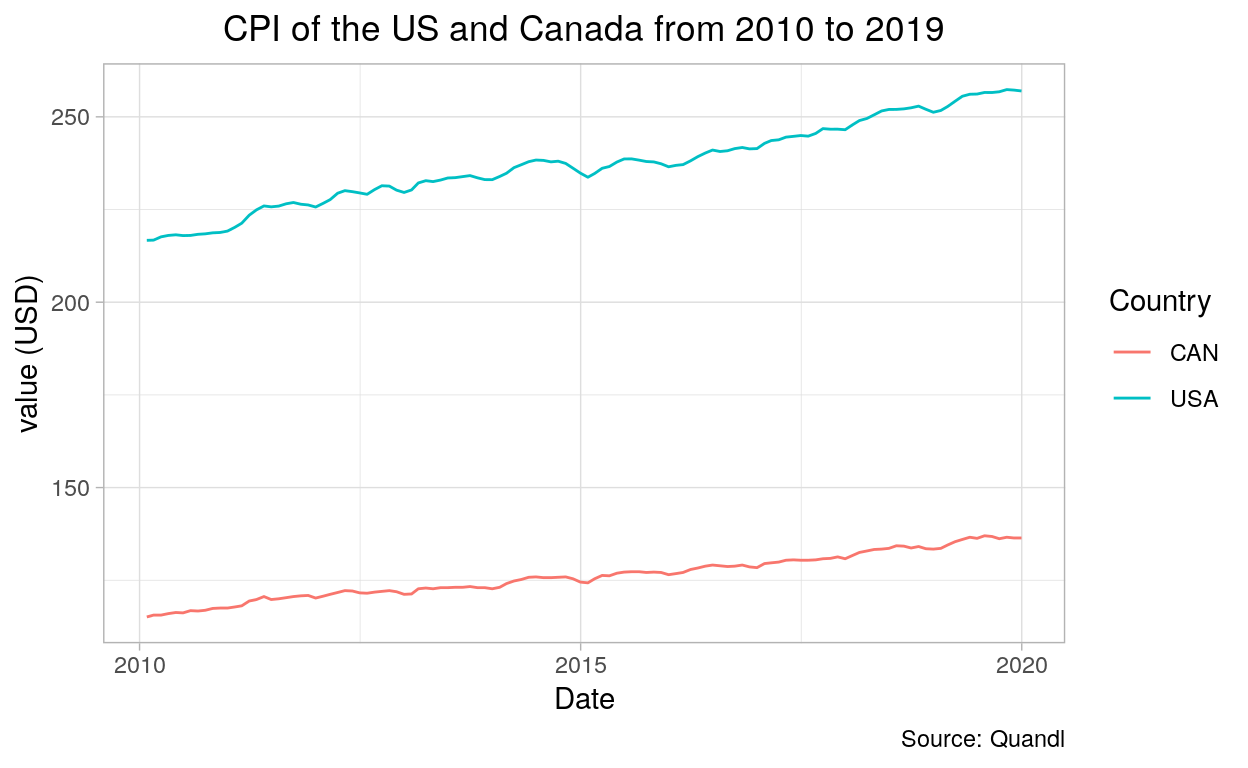
The Consumer Price Index (line chart)
# Data Wrangling : add a new column
library(dplyr) # load the "dplyr" library
mydata_usa$Country <- "USA" # add column "Country" and each variable in the column will be named USA
mydata_can$Country <- "CAN" # add column "Country" and each variable in the column will be named CAN
df_new <- bind_rows(mydata_can, mydata_usa) # merge the 2 data frames together using the "bind_rows" function
# Create your graphic
library(ggplot2)
ggplot(data = df_new, aes(x = Date, y = Value, color = Country)) +
geom_line() +
theme_light() +
theme(plot.title = element_text(hjust = 0.5)) +
labs(title = "CPI of the US and Canada from 2010 to 2019",
x = "Date",
y = "value (USD)",
colour = "Country",
caption = "Source: Quandl")
Total revenues of companies before 2019 (bar chart)
library(ggplot2)
ggplot(data = mydatafun, aes(x = comp_name, y = tot_revnu)) +
geom_col(fill = "#255293") +
theme_light() +
theme(plot.title = element_text(hjust = 0.5)) +
labs(title = "Total revenues of companies before 2019",
x = "Companies",
y = "Total Revenue (USD)",
caption = "Source: Quandl") +
theme(axis.text.x = element_text(margin = margin(t = .1, unit = "cm"), angle = 90)) +
theme(legend.position = "none")
Another example
# Enter your API key in the function "Quandl.api_key"
Quandl.api_key("abcdefghijklmnopqrstuvwxyz123456")
# Extract your data from the Quandl package
JobUSA = Quandl.datatable("JL/JD2")
# Data Wrangling
names(JobUSA)[names(JobUSA) == "location_name"] <- "location" #rename column
names(JobUSA)[names(JobUSA) == "job_title"] <- "job" #rename column
names(JobUSA)[names(JobUSA) == "organization_country"] <- "country" #rename column
names(JobUSA)[names(JobUSA) == "region_label"] <- "NAME" #rename column
names(JobUSA)[names(JobUSA) == "organization_city"] <- "city" #rename column
JobUSA$country <- gsub("US", "USA", JobUSA$country) #change the term US for USA in the "country" column
JobUSAsub<- dplyr::select(JobUSA, NAME, posting_count) # select only relevant data in your data frame
JobUSAagg <- aggregate(posting_count ~ NAME, data = JobUSAsub, sum) # use the aggregate function to sum up entries in the "NAME" column that are the same
# Open your shp file with the readOGR function
USmap <- readOGR('cb_2018_us_state_500k.shp')
OGR data source with driver: ESRI Shapefile
Source: "/home/marinel/portfolio/warin/_posts/api-quandl-application/cb_2018_us_state_500k.shp", layer: "cb_2018_us_state_500k"
with 56 features
It has 9 fields
Integer64 fields read as strings: ALAND AWATER # Use "Left join" function to combine your two data frames
USmap@data <- left_join(USmap@data, JobUSAagg, by = "NAME")
# Create labels
USmap@data$NAME <- as.character(USmap@data$NAME)
USmap@data$posting_count <- as.numeric(USmap@data$posting_count)
labels <- sprintf("<strong>%s</strong><br/>%g", USmap@data$NAME, USmap@data$posting_count) %>% lapply(htmltools::HTML)
# Determinate the intervalls that will be shown in the map legend
bins <- c(0, 5, 10, 15, 20, 30, 40, 50, 60, 70)
# Choose a color scheme for your map
colors <- colorBin("Blues", domain = USmap@data$posting_count, bins = bins)
# Plot the data using leaflet
leaflet(USmap) %>%
setView(lng = -95.712891, lat = 37.090240, zoom = 4) %>%
addProviderTiles(providers$CartoDB.Positron) %>%
addLegend(pal = colors, values = USmap@data$posting_count, opacity = 0.7, title = NULL, position = "bottomleft") %>%
addPolygons(fillColor = ~colors(USmap@data$posting_count),
weight = 2,
opacity = 1,
color = "white",
dashArray = 1,
fillOpacity = 0.8,
highlight = highlightOptions(weight = 2,
color = "black",
dashArray = 1,
fillOpacity = 0.7,
bringToFront = TRUE),
label = labels
)
The map above illustrates how many job postings have been counted in each US states, all professions, organizations, contract type, education level and working hours combined.